Case Study
Reporting Revenue Variances to budget
Service Provider
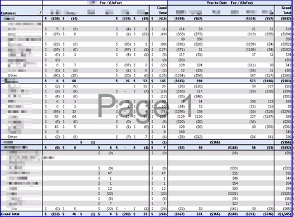
Problem: Revenues were budgeted by Customer and Segment. Actual reporting required so many pages that it was difficult to understand where volume was significantly varying from Budget.
Solution: Calculate variance of Actual to Budget and just display that by Customer and Segment. Further, Identify top 10 vs. All Customers.
Results: All Sales reporting (Period and Year-to-Date) are accomplished on two pages.
Tools Used: Excel Data Models “Measures”. Measures are a powerful feature that complete calculations outside the spreadsheet and return results in Power Pivot Tables.
Case Study
PRODUCTIVITY PROBLEMS
Manufacturer
Case Study
CONTRACTOR FAILED
Service Provider
Case Study
ANNUAL BUDGET, CASH FLOW PROJECTIONS
Service Provider
Case Study
WEEKLY DASHBOARD COMPARED TO GOALS
Service Provider
contact dave
Can I get you on a path to financial health? Contact me to set up a free 2-hour assessment so I can hear more about your needs. Use the contact form below or call 317-670-8781.

