Case Study
Manufacturer
Productivity Problems
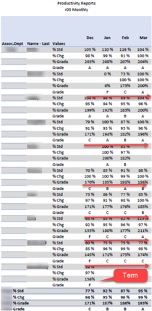
Problem: Owner advised employee production in two key departments was too low and wanted a scorecard Managers could use with employee to address.
Solution: Created Reports that provided numerous statistics summarized by employee, department, and or Product levels. Converted Productive percentage and percentage of Standards into an equivalent A thru F ranking.
Results: Based on the reports, Managers placed under-performing employees on Performance Improvement Plans (PIPs). Over the course of 90 Days, some employees were terminated, others improved from C to A thru coaching.
Tools Used: Excel Power Pivot. Created ODBC links to automatically refresh Time Clock data fields in the Data Model. Associated Tables in the Data Model with Standards provided by the Owner. Documented instructions and exception reports in the model enabling Managers to run the report daily, scrub the data and review final reports for action with employees. Published monthly comparative results with the monthly financial statements demonstrating to the Owner progress made and remaining action plans.
Case Study
SERVICE PROVIDER
Reporting Revenue Variances to Budget
Case Study
SERVICE COMPANY
Contractor Failed
Case Study
SERVICE COMPANY
Annual Budget, Cash Flow Projections
Case Study
SERVICE COMPANY
Weekly Dashboard Compared to Goals
contact dave
Can I get you on a path to financial health? Contact me to set up a free 2-hour assessment so I can hear more about your needs. Use the contact form below or call 317-670-8781.


